
Strava Metro utility cycling data (2021, blog part 3)
- Nov 10, 2022
- 11 min read
Updated: May 1, 2024
The Netherlands now has (by our estimate) one million Strava users. For most users, cycling, mountain biking or running is their main activity. But; once the app is installed, Strava also records many 'commuting' or utilitarian cycling trips.
Despite utilitarian cycling not being the most frequently recorded activity within Strava, it is perhaps the Strava Metro dataset with the greatest potential. After all, 96% of Dutch bike rides are (primarily) utilitarian in nature (CBS). If Strava utilitarian bike rides are representative of a distinctive proportion of them, it provides valuable insight into an important use of city and landscape.
Within Strava, activities are characterised as utilitarian if either the cyclist marks this themselves (tick 'commute' button), or if an activity has the same characteristics as that group of 'commuters'. For example, based on start and end points of a route, it can be clearly recognised whether this is an 'from A to B' cycling activity. This is done by an algorithm from Strava Metro itself. At Endomondo data, we have investigated such distinctions ourselves in several cities. For more information; see, for example, this paper (p15-20) from Utrecht. But such a distinction can well be made based on such characteristics of cycling activity (including time of day, distance, detour factor and speed).
Strava use of utility cyclists
In Strava, out of 287 million 'bike rides' worldwide in 2018, some 84 million were 'commutes' (29%). So the rest are 'leisure rides'. In 2021, this commute share seems to be somewhat lower in the Netherlands. Based on the province of Utrecht, we can give an indication.
In 2021, the Province of Utrecht recorded 272,825 commuting rides and 1,365,638 'leisure rides'. Around 17% of all Strava bike rides in Utrecht are thus utilitarian. 1 in 12.9 Dutch people live in the province of Utrecht. Calculated through, approximately 3.5 million utilitarian cycling activities would then be recorded with Strava throughout the Netherlands. This calculation is a slight overestimation, because part of those cycling trips do not come from residents of the province of Utrecht, but from people who live (just) outside it, but their cycling trip does pass the province of Utrecht. This is expected to be a minority though; 3 million is probably reasonable as a rough estimate.
What share of the total number of Dutch bicycle trips does this represent? At 4.4 billion Dutch bike rides per year; it would amount to 1 in ~1500 utilitarian bike rides being recorded with Strava. On the one hand, that sounds like little; but it's already 7 times as many bike rides per year, for example, as were made in Bike Week (416,000 in 2016).
Characteristics of users

Strava is used more by men than women, but women are on a strong rise. This is not only true in Province of Utrecht, and within cycling activities; it is visible globally within all activities. Note; a distinction of men and women is given per road/path in the tables, but counted as 'number of unique men' and 'number of unique women'. So not the number of passages. The percentages show the averages for all roads in Province of Utrecht.
Men still predominate in both utilitarian and sport cycling, but the equality is considerably greater in utilitarian cycling, where women are on average 39% of the number of unique people, men 61%. The distributions are becoming more equal; in 2019, women made up 26%.
In sport cycling, it also plays a (slight) role that men cycle on average slightly longer distances than women, and also cycle slightly more often. In doing so, they also pass more trails. The distribution in 'number of activities' or 'number of sports-cycling Strava users' will be slightly more equal than 78%/22%.
Representativeness Strava Metro utility cycling data
It is precisely in the 'bike_commute' activity type that representativeness is most relevant and complex. For two reasons; (1) because Strava bike commutes represent only a minimal proportion of total bike commutes (~1 in 1500), and (2) because Strava bike commutes have distinctive characteristics that differ from 'the average' utilitarian bike ride'.
The frequently asked question around 'representativeness' is to what extent the intensities of use, resulting from Strava data, correspond to the 'actual' intensity of use? In other words, do Strava utilitarian cyclists proportionally cycle the same routes as 'average' utilitarian cyclists?
The simple answer to that question is: no.
Strava cyclists/cycling trips certainly do not represent a perfect cross-section of all Dutch cyclists/cycling trips. For that matter, no form of 'crowd-sourced' cycling data does.
But in our view, that is not the most relevant question. More relevant is for which more specific types of utilitarian cyclists is the data more representative, and for which utilitarian cyclists less so? Because that is the beauty of data generated by real people, and not by traffic models. It ís always representative: at least for the group of people who use Strava, and the kind of activities they record with it. And the follow-up question is then: are the route uses of the group(s) it 'properly' represents interesting and relevant?
Distance
Over the past five years at TRACK-landscapes, we mainly analysed data from the activity tracking app 'Endomondo', which, as with Strava, was also used for utilitarian cycling trips.
The main factor characterising both Strava and Endomondo's utilitarian cycling activities turned out to be 'distance'.
It is a logical characteristic, with major implications for route use. Those who cycle a few kilometres will rarely record it with an activity tracker; it is not substantial enough as an achievement or movement for most. But if the cycling distance is longer, this is seen as more substantial achievement/movement. Utilitarian cyclists are relatively more likely to record such a longer bike ride with an activity tracking app.
The average utilitarian bicycle ride in the Netherlands is 4.1 kilometres (CBS). Almost 70% of bicycle trips, are shorter than 3.7 kilometres (long bicycle trips influence the average relatively strongly). Most bike rides are therefore done to run errands, shop or go out.
This is very different for Strava utilitarian bike rides:

globally, the average utilitarian Strava bike ride was 15.4
kilometres (Strava YIS 2019). In several European countries (Netherlands unfortunately not known), the median cycling distance was around 8 kilometres. In utilitarian cycling data (2012-2017) from the app Endomondo, that distance (in the province of Utrecht) was fairly similar; the median was 10.4 kilometres and the average cycling distance 15.5 kilometres (see figure to the right).
And whether we are talking about walking, running, recreational cycling or utilitarian cycling: we have seen in many different cities that the distance to be covered is very decisive for which roads are used much or little. This does have different reasons in those different types of activities.
Long utilitarian bicycle trips (5-30km) in the Netherlands are easily inter-urban (also called supra-local, regional): from one work/residential centre to another work/residential centre. The type of destination is more likely to be a work location, for example, or a regional facility. Thereby, inner-city cycling routes are mainly used that logically connect to through routes between different centres.
Short utilitarian bicycle trips (<5km) will mostly be made to do shopping, or to the city centre, or to the sports club. Those destinations tend to be in places other than major work locations and regional facilities; which also makes the use of cycling routes substantially different.
The Endomondo data also showed this very strongly in the province of Utrecht. The picture of bicycle use of the city for bicycle trips of 0-5, 5-10 and 10+ kilometres, is very different. Long bicycle trips have a much more widespread picture of route use (see image below).

Comparisons with counting points (Endomondo)
You can, of course, compare utilitarian cycling data from activity trackers such as Strava or Endomondo, with local cycling counts. In Utrecht, for example, we compared local cycling counts and utilitarian cycling data from the app Endomondo.
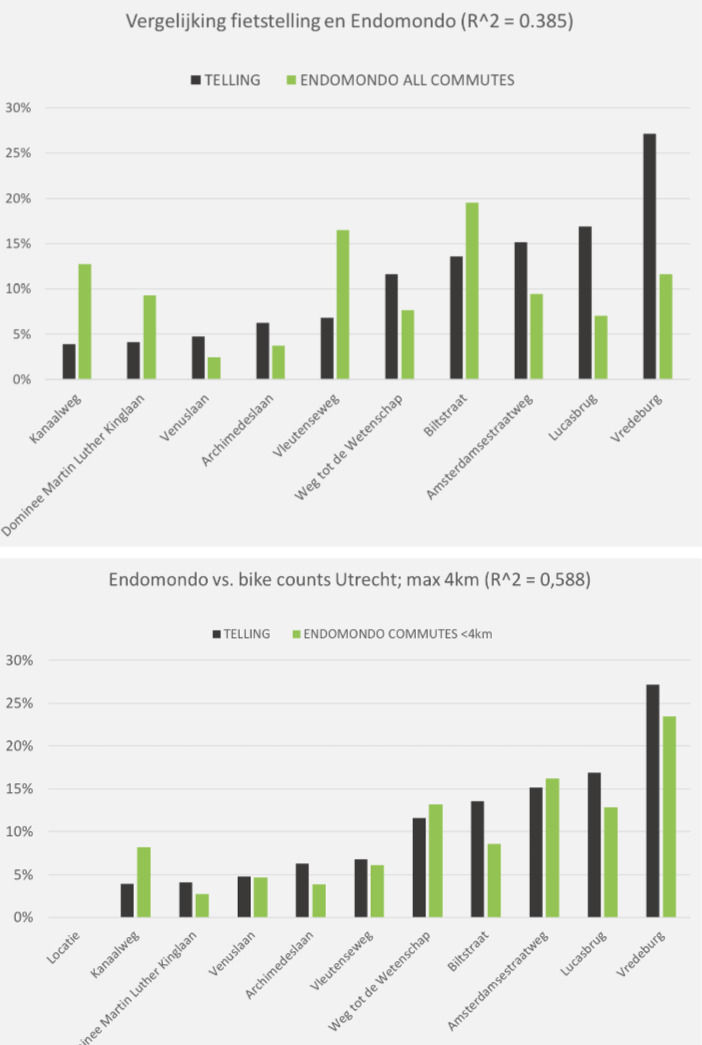
If you compare the total numbers of passages in these, there is absolutely no similarity/connection visible at the counting points (R^2=0.385). The most passed cycle routes, are often not the most passed cycle routes within Endomondo (top image).
But what if, within the Endomondo dataset, we take all utilitarian cycling activities less than 4 kilometres long? After all, that distance has the vast majority of inner-city cycling activity where these measurement points are located. Then suddenly the equation is considerably better (R^2=0.588, see image to the right). To wit; the total Endomondo dataset was about 15-20 times smaller than the current Strava Metro dataset in Utrecht. The selection 'up to 4 kilometres' made this dataset another 7 times smaller. For example, 'Vredeburg' had 2300 utilitarian cycling passages over five years, of which 350 passages came from activities shorter than 4 kilometres. Strava at this point already had 8500 utilitarian cycling passages in one year.
And this is also why in Flemish Brabant (see blog 'Strava sports-recreational cycling') the comparison between the counting points and the Endomondo cycling data showed a strong correlation: these counting points were all outside urban areas, inter-urban. You cannot get there if you cycle only a few kilometres, only 'longer' cycling activities pass there. And so it compares well with utilitarian cycling trips from activity trackers: these too contain mostly longer cycling trips. In the figure on the right, the ratios utilitarian/recreational are shown at census points. The left of the two bars shows the ratio on the local count, the right bar the ratio obv Endomondo data. The comparison with Flemish Brabant was made, by the way, because (as far as we know) only here utilitarian and recreational cyclists are distinguished from each other on a local bicycle count. The ratios between the census and Endomondo data are quite correct; despite the fact that the Endomondo dataset was extremely small (even smaller than in the Netherlands).
Comparisons with counting points (Strava)
So do those Endomondo insights also apply to Strava? Of course, that conclusion can't simply be drawn one-to-one; it is conceivable that Strava-utilitarian cyclists have different characteristics than Endomondo-utilitarian cyclists. But one very important trait, undertaking 'long' bike rides, is similar. The age distribution and gender distribution of Endomondo and Strava are also of great similarity.
At the moment, we do manage to compare local cycling counts in IJsselstein (where we also have access to Strava Metro). In IJsselstein, it is interesting that the bicycle counts were done around the residential core, to measure regional bicycle movements. The local counts were done in May 2019, the graph shows the comparison with Strava commute passages throughout 2019. The correlation comes out to R^2 of 0.55; there is a correlation but it is not very strong.

However, the tricky part of this comparison is that most points are really outside urban areas, but not all of them. The counting point 'Randdijk' concerns the main bicycle connection to Nieuwegein Centrum, which is only 3-5 kilometres cycling from IJsselstein. On this bike path, Strava scores the most 'underwhelming'. But that makes perfect sense if Strava actually represents lower bike rides. Without this Randdijk, R^2 would come out at 0.72.
The counting point where Strava scores the most 'above par' is 'the Lagedijk'. This is a very scenic, narrow cycle path. It could be, for example (and this is a hypothesis), that Strava utilitarian cyclists, are above-most willing to cycle a small diversions, if it is a very scenic route.
This remains the tricky part of these kinds of comparisons; to know even better whether Strava_commutes represents the longer cycling movement well, you should ideally compare that with other sources/surveys/counting points that actually show the long cycling trips. But: there aren't any. At least; as far as we know; if you do know of studies with this focus, we would love to hear about it!
However, that absence of specific knowledge about long cycling movements is exactly what makes the Strava Metro data potentially so valuable.
Scientific studies/comparisons (Strava)
Several scientific institutions have also examined Strava cycling data for representativeness and usability. The article "Strava Metro data for bicycle monitoring: a literature review" summarises scientific research on this.
Several (mainly US) studies concluded that Strava data can add value to other methods that estimate cycling intensities. Some studies -as we did- compared local cycling counts with Strava counts. The studies were undertaken in America, Canada, Australia, UK, and Germany. The R-values (expressed strength of correlation) were >0.75 in 5 of the 9 studies. That's a decent correlation. But those R-values also varied widely, between 0.3 and 0.5 also occurred.
This also shows the difficulty of global-generalising about Strava data representativeness. Bicycle use, and also Strava use, is so different worldwide that it is very difficult to adopt conclusions for one country for another. And that certainly applies to the Netherlands; the Netherlands is incomparable to other countries in terms of urbanisation (small, sprawling cities), cycling infrastructure and bicycle use (highly developed, but also specific demographic differences). Conclusions about Strava representativeness in the Netherlands should really be based on comparisons/research in the Netherlands.
However, studies do conclude that the Strava data is technically offered in a useful way, the accuracy of GPS devices and the translation to passages of streets/paths/roads offers good possibilities. What this also indicates in the review is that Strava Metro has proved useful for doing intervention evaluations. In several studies it turned out to be quite possible to see changes in use after adding or improving a bicycle route. The general question regarding representativeness of Strava data/ Strava user obviously remains valid within this; who represents this visible change? Does this Strava change apply equally to local cycling counts? This is still under limited investigation.
In general, the review notes that a lack of demographic data and cycling trip (nature) data such as origin-destination relationships, limits the view on representativeness. We recognise this limitation, at the same time we think that our insights and comparisons in this regard are a valuable addition.
Indeed, it is striking that the most defining feature of activity tracking data is unnamed in all these studies. As far as our measurement experience is concerned, this is the distance to cycle. Differences in origin-destination are mentioned, but the fact that this is caused by the fact that activity trackers are usually only used when cycling distances are longer than a few kilometres is not emphasised. The question of whether Strava-like data can indeed be a good representation of 'regional' or 'long-distance cycling' is therefore not raised. And that, in our view, is precisely the most important question to be asked with these datasets. In the Netherlands, but not unlikely in other countries as well.
Conclusions Strava utility cycling data
It is desirable to make comparisons between Strava Metro data and local counting points in more places (in the Netherlands). Then an even better picture can emerge of who and what Strava Metro does and does not show. You can already conclude, though, that the total/average Strava Metro cycling dataset does not give a good representation of total/average Dutch cycling use.
But, if you want to use cycling data to better understand cyclists' needs, motivations and route use, 'total bicycle use' or 'average bicycle use' is not at all interesting. Precisely because, for example, short cycle trips give a totally different picture of route use than long cycle trips (mainly due to different destination), and those cyclists also have different preferences and motivations.
Totals of bicycle passages' may be relevant to pure capacity issues of cycle paths/roads, for instance, for which bicycle data seems to be used a lot at the moment. But as far as we are concerned, that is not where the greatest potential of cycling data lies. Good bicycle policy should essentially be about insight and understanding of different needs of different cyclists.
And based on the various comparisons we have made so far, the picture does emerge that Strava Metro data can give a good representation of a specific group of cyclists/cycle rides, namely 'long distance', regional bicycle traffic.
Is that group of cycling activities interesting and relavant? As far as we are concerned, right! What various research in the Netherlands shows (KiM), that the bicycle has the potential to reduce car use precisely in that longer bicycle movement. With the rise of the electric bike, these longer distances are becoming more frequent and easier. For this reason, Dutch municipalities and provinces are placing an increasing emphasis on improving regional cycling routes, between different residential centres. And for that purpose, it is very valuable to separately map bicycle use for bicycle trips over longer distances. To get a better grip on specific route preferences and use(s) of that group of cyclists.
And that is exactly what local bicycle counts cannot do. So every way of measuring, every dataset, has certain possibilities and limitations. It is almost never a question of 'representative or not'.
It would therefore be nice if in Strava Metro datasets, a subdivision was made into 'distance categories' (e.g. 1-5km, 5-10km,10-20km, >20km). It would not surprise us -based on the insights from the Endomondo data- that Strava data could then even give a decent representation of short-distance cycling use.
And to all this, I end with a call: do you know any data on local cycling counts, both inner-city and extra-urban? Or: research into differences in route use between long-distance and short-distance bicycle trips? If so, we would love to do (even) more research to paint an (even) better picture of the opportunities this dataset offers!
Curious about the ways in which we translate Strava Metro data and other activity tracking data, insights into sports-recreational cycling into spatial development opportunities?
At Utrecht, we mapped the shared interests of recreational and utilitarian cycling with data from Endomondo, see for instance the blog mooi-snelfietsroutes. In the 'Fiets+OV' study, we used data from the bicycle week to map which routes towards stations are cycled. We translated this into development opportunities for the station environment.


Comments