
Strava Metro Walking and cycling data (2021, blogpart 1)
- Sep 24, 2021
- 6 min read
Updated: May 1, 2024
Data from exercise apps; many spatial and mobility visions have mentioned and continue to mention this type of source as a promising application. But as simple as it is to name the opportunity, it seems not to be self-evident (a) to recognize which sources there are (b) to explain which types of users this does and does not represent (representativeness) and (c) how you translate data into knowledge, translate that knowledge into insights, and translate those insights into spatial development opportunities.
For us (Mart Reiling and Thijs Dolders, TRACK-landscapes) this has been one of the most important research methods over the past five years to gain insight into the use of cities and landscapes. We consider the movement of people as a way of 'speaking with our feet'. Speaking about our motivations, our spatial experience and preferences. In our view, knowledge and understanding of this is indispensable in spatial assignments.
In recent years we have seen a ‘come and go’ of possibilities. Data from the ‘fietsstelweek’, human.co, Endomondo, Runkeeper, Strava and more. Divisive opportunities 'went'; the market for exercise apps is changing rapidly and stricter privacy laws caused several open data sources to close.
But against that stream, one of the Netherlands' most widely used activity tracking apps 'Strava' came up with some interesting news last winter. Whereas in recent years Strava's data was only accessible for a fee (a $1 per user per year), Strava now offers free access to the (anonymized and aggregated) spatial route data generated by their cycling and running users. Governments can thereby access their district/municipality's data. Commercial institutions and research institutes can also get that access if they are commissioned/collaborated with that government.
But what do we know about this source of data? What types of bicyclists and runners does it and does it not represent? What possibilities do the offered data structures give? And for what applications might this be valuable now and in the future? We see a lot of potential and value in these datasets, and at the same time challenges, and opportunities to enrich the datasets. In this four-part blog series, we provide insight into this.
In parts one we address a general description of Strava and Strava Metro, in part two we consider (sporty) recreational cycling, part two utilitarian cycling, and in part 3 running/foot.
Blog part 1: What is Strava (Metro)? The analytical possibilities explained

Strava has been around since 2009 and is now based in California, US. With now over 80 million users worldwide, it is one of the largest 'activity-tracking apps' in the world. Strava grew by over 2 million new users per month in 2020/2021. Strava is best known for its fanatic-sports nature. Strava allows cyclists and runners to compare personal speeds on 'segments' (user-defined stretches of road) with other Strava users. In the first few years, it attracted mainly fanatical cyclists and runners, including well-known users such as Lance Armstrong and Laurens ten Dam. But in recent years, the use of Strava in the Netherlands is becoming more mainstream. With possibilities to place activities with photos on your timeline, Strava is increasingly becoming a sporty/active form of social media in which friends and family can follow each other's active experiences and lifestyle. And this is also increasingly visible in the activities that are recorded with Strava. There are dozens of "activity types" within Strava, but with regard to analyzing space usage, there are currently three interesting groups that can be distinguished:
1. Sport/recreational cycling: Recreational cycling (cycling as a leisure activity) with a sporty nature/motivation. Most Strava recreational cycling rides have a sporty nature (hence why we choose this term), but not all. A small proportion are only 'recreational cycling'.
2. Utilitarian cycling: Cycling activities with primarily a transportation/moving motive. Strava itself speaks of 'bike commutes', however 'commute' normally refers to only commuting bike trips. But the Strava 'bike commutes' includes all types of utilitarian bike trips, including for example to a shopping mall, friend or sports club.
3. (Running): Within Strava, running activities and recreational walking activities are combined under one heading; 'foot'. However, it is mainly running activities, the share of recreational walking activities is relatively small.
Strava Metro Data structures
Before we look at the different types of user groups separately, we first show which data can be obtained, in which structures. These data structures are in fact the same for the different groups.
Obviously Strava cannot and does not want to share personal data, therefore data is aggregated to street level. In the tables that can be downloaded via Strava Metro, it is clear for each street, road or path in the OpenStreetMap, how often it has been passed by someone who recorded his ride/run with Strava.
Strava first makes a division into 'foot' and 'bike'. Within these two activities, you can then choose whether you want to download a data table of only 'commute', 'leisure', or both (added together). For 'bike' this is a very useful division, for 'foot' the share of commute is so low that the analytical possibilities are too small (in Amsersfoort 2% of all 'foot' activities).
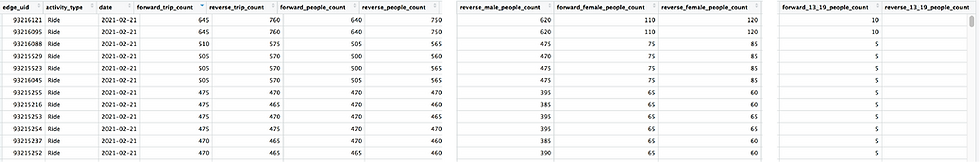
The table that can be downloaded consists of thousands of rows and over 30 columns. The rows consist of the OSM street segments, the so-called 'Egde _UID'. For each street segment several subsets (columns) are created. All columns listed below exist in duplicate, both road directions have one column. In some columns the number of passed trips is counted:
- Total trips count
- Morning / Evening trip count.
- Leisure / commute trip count.
Other columns do not count the number of trips, but the number of people (unique persons) passed through:
- Male / Female
- Age 13-19 / age 20-34 / age 35-54 / age 55-64 / age 65+
In addition to these subdivisions, there is another subset/column:
- Avg Speed; average speed on the street segment
Then, choices can still be made for different timeframes from which you want to download the data. The above columns are the same for the tables of these timeframes, the differences are within the rows. Strava gives four choices:
- Yearly. The sum of passages over a full year. You can choose all individual years from '2016' to '2020'. 2021, as an incomplete year, is not yet available.
- Monthly. The sum of passages over a month. A maximum of twelve months can be selected, each of these months gets one row per street segment.
- Daily. In this, within the time frame of up to three months, each day has one separate row for each street segment.
- Hourly. In this, within the time frame of up to one month, for each day of this month, for each hourly, one row for each street segment. So in theory, this produces a huge number of rows.

When counting in the downloaded table, it is always rounded to '5'. This adds a kind of extra privacy layer, if only one person has been on a road it is invisible. It should be at least three (that is rounded to 5). However, this does result in a problem within the 'daily' and 'hourly' data frames. Within one day, on most of the streets, no three Strava users pass. For example; in IJsselstein and Amersfoort (where we already applied the Strava data) ~80% of the streets never reach 3 'bike_leisure' trips per day, and ~95% of streets never reach 3 'bike_leisure trips' per day. In the 'hourly' data frame, this number of streets that drop out is even greater.
The data frames 'hourly' and 'daily' therefore only say something about roads that are passed very often. Time patterns of those roads can be analyzed. But for analyses of route use these data sets offer limited possibilities.
For this reason the data frames 'monthly' and 'yearly' are added, in which a sum of longer periods is made. Within these data frames, rounding to 5 is no longer a problem.
However, the columns of these data frames offer few opportunities for making spatial analyses time-specific. For example, there are no columns of 'hours of the day' in these data frames, so that differences in route use during daylight vs. in the dark, cannot be made. Also, for example, there is no difference between 'week' and 'weekend', which would be an interesting distinction for almost any type of activity.
Analytical possibilities Strava Metro
But, there are still several interesting analyses to be made with the Strava Metro data, for both sport-recreational cyclists, :
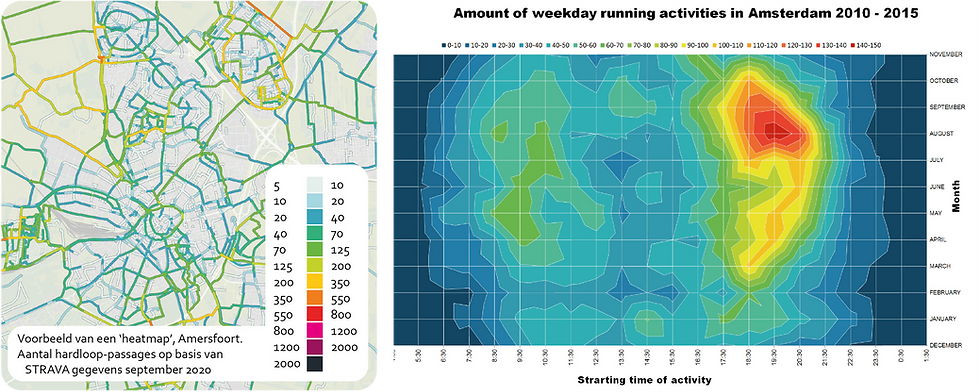
- Maps of route usage (so-called heatmaps).
- Maps of route usage; changes through months and years (from 2016)
- Maps of route use; comparisons between different age groups and genders.
- Maps of speeds on routes.
- Time patterns of use, of very popular routes.
Curious about how we translate this kind of analysis into visions, strategies and design proposals? In Amersfoort we mapped the use of cyclists, runners and mountain bikers with data from Strava Metro. In Brussels we used data from Endomondo, to design a more runner friendly city.


Comments